Canoco是一套在生态学及几个相关领域内使用ordination methods来进行多变量统计分析的最常用程序包。Canoco最近版本(4.0和4.5)的用户指导在过去16年(1999-2014,ISI Web of Knowledge)中已经被引用达6800次。
Canoco 5是一套全新的,几乎完全重构的Canoco软件版本,在2012年10月发布。

Canoco for visualization of multivariate data
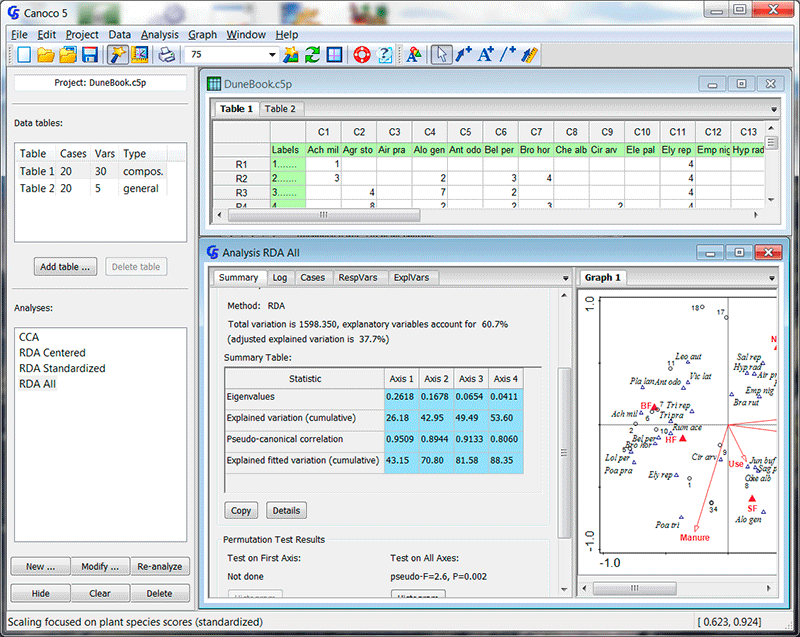
Canoco 5 arrived! Canoco is a software package for multivariate data analysis and visualization, with an emphasis on dimension reduction (ordination), regression analysis, and the combination of the two, constrained ordination.
The completely new Canoco 5, released in 2012, has been updated to Canoco 5.1. Recent Canoco versions (4.0 and 4.5) were cited more than 4900 times in the past 10 years (2002-2011, ISI Web of Knowledge). Canoco 5 implements many recent advances in ordination, such as variation partitioning, co-correspondence analysis, and distance-based redundancy analysis, but the major advance is in user-friendliness.In Canoco 5, data import, analyses and making graphs are integrated in a single Canoco 5 project. The Canoco Adviser helps in choosing data transformations and methods of analysis. Numerical analyses that used to take many runs, are now available through a single analysis template and the Analysis Notebook concisely summarizes the results and allows access to the full results. All analyses done on a set of data tables are now collected within Canoco 5 projects, sharing the analytical and graphing settings. Canoco 5 helps to make even better publication-quality ordination diagrams. The manual has been largely re-written and the large set of real-life examples is updated and extended to show new ways of working with multivariate data.
Analytical and graphing capabilities are integrated with an easy-to-use spreadsheet data editor in a single program. All analyses done on a set of data tables are now collected within a Canoco 5 project, sharing the analytical and graphing settings.
All statistical methods offered by Canoco for Windows 4.5 are available, such as DCA, CA, CCA, DCCA, PCA, and RDA methods – including their partial variants, with Monte Carlo permutation tests for constrained ordination methods, offering appropriate permutation setup for data coming from non-trivial sampling designs.
For newly available methods see below.
All visualization tools offered by CanoDraw 4.x are available (including loess, GLM and GAM models for the visualization of data attributes in ordination space) and many of them are improved.
Data can be entered within the program itself or easily imported from Excel (.XLS or .XLSX formats) or from Canoco 4.x data files. Labels no longer need to be shortened to 8 characters, but these brief forms are still available for display in the ordination diagrams and can even be automatically generated from the long ones. Standard coding of factors (categorical predictors) is now used, dummy (0/1) variables are generated internally. The editor allows transformation from dummy variables to factors and, if needed, the reverse.
Principal coordinate analysis (PCoA) and distance based RDA (db-RDA) are now easily accessible, with new distance measures added (11 distance types in total, including Bray-Curtis, Gower distance, or Jaccard coefficients). Similarly, non-metric multidimensional scaling (nMDS) is also supported.
Variation partitioning is easily accessible for two or three groups of predictors including calculations of individual fractions of explained variation, based either on partial or non-partial analyses and using either raw or adjusted variation estimates.
Principal coordinates of neighbour matrices (PCNM) method is available within the variation partitioning framework. Present implementation matches the suggestions described in Legendre & Legendre (2012) under an alternative method name (dbMEM).
Computing, testing and graphing of the Principal Response Curves (PRC) is now an easy task.
Co-correspondence analysis (CoCA, symmetric form) is available, including Monte Carlo permutation testing of the covariation among the two compared community types.
Stepwise selection of predictors was visually enhanced and provides now the support for protection against Type I error inflation (preliminary test with all predictors and the adjustment of p values by one of three methods: false discovery rate (FDR) estimates, Holm correction, and Bonferroni correction.
Straightforward testing of all constrained axes as well as comparing results of two ordinations with Procrustes analysis is available.
You can easily work with species functional traits or import the data on phylogenetic relatedness of species, as well as calculate and use functional diversity.
Visualization capabilities were enhanced with features such as the semi-transparent fill colours, displaying calibration axes for variable’ arrows in ordination diagrams, or plotting enclosing ellipses as an alternative to enclosing polygons. Additional types of export in JPEG, TIFF, and PDF file formats were added to existing ones (PNG, BMP, EMF, Adobe Illustrator).
Every step of your work is supported by an context-sensitive help system and by the Canoco Adviser – an expert system that helps you to select a proper analytical method for your research question, correct type of ordination model (linear vs. unimodal), data transformation, or appropriate visualization of the results. It even advises you how to interpret ordination diagrams you create with the help of Graph Wizard.
Advanced users can combine multiple methods in a single analysis, including generalized linear models to correlate scores etc.
Home Page:
http://www.canoco5.com/
http://www.microcomputerpower.com/
下载地址
生态学数据处理软件Canoco 5.02
落尘之木:https://pan.luochenzhimu.com/disk/software/Canoco/
百度网盘:https://pan.baidu.com/s/1ZRhXoW592nN2xh37iMaVTA
激活方法
运行INSTALL.EXE安装,使用以下试用许可证:
Name: Any
Comany: Any
License code: c599999
根据系统位数选择Runasdate_x64或者Runasdate_x86,复制到某个软件存放位置
在需要运行的程序填入:C:\Program Files\Canoco5\CanoWin5.exe
时间调整为2010年
在创建桌面快捷方式填入:Canoco 5
然后就可以打开软件了
 落尘之木
落尘之木


您好,是否有CANOCO5.02软件进行RDA分析的中文步骤
您好,我下载您发的CANOCO5.02软件,,运行的时候说必须使用32位的RunAsDate来运行32位的应用程序,这种情况应该怎么办
这软件有32位和64位,根据位数使用对应的RunAsDate