GraphPad Prism 集生物统计、曲线拟合和科技绘图于一体,其所具有的功能均非常实用和精炼,包括了一些特色的功能,如ROC曲线分析、Bland-Altman分析等;曲线拟合功能是GraphPad Prism超越其他统计软体的制胜法宝,GraphPad Prism的线性/非线性拟合功能使用操作极其方便,不仅内置了常见的回归模型,还专门内置了Aadvanced Rradioligand Bbinding, Bacterial Growth, 剂量反映曲线,峰拟合等数十个生物统计模组,GraphPad Prism的绘图功能也很具特色,无需专门绘製统计图形,只要输入资料,图表自动生成且随资料改变及时更新,非常方便实用。
能进行自定义方程曲线拟合的软体中,GraphPad Prism的操作最为简便快捷,拟合前参数设置方便,拟合速度快,并支援批量拟合,这在同类软体中非常少见,可以说GraphPad Prism当之无愧为非线性拟合的高手。
Prism 在科学图表的绘制方面可以视为Sigmaplot的替代软体,但是却又包含了简单的试算表,可以直接输入原始数据,软体自动计算标准差和p value,此外,也包含了其他几项数值分析的能力。
GraphPad Prism是一款强大的专业医学绘图软件,中文名棱镜,最初只是为医学院校和制药公司的生物学家设计的软件,用于处理复杂的科研数据,并生成更容易理解的曲线等学术图形。经过数年的迭代和功能增强,GraphPad Prism 如今已经被各种生物、物理以及社会学家广泛使用,有超过 110 个国家的 20 万科学家每天通过其完善自己的科研报告。GraphPad Prism 虽然不比那些专业且大型的数据统计工具,但它依旧可以让您轻松执行实验室和临床研究人员常用的基本统计测试。GraphPad Prism 提供检验、非参数比较、一维、二维和三维方差分析等统计方式,并以清晰的语言呈现分析结果,避免了专业软件里复杂且冗长的统计报告。除此之外,您可以在任何数据分析对话框中通过「Learn」按钮获得分析原理解释,以帮助您做出更好的选择,当您确认了分析原理,GraphPad Prism 便即刻呈现分析结果。
GraphPad Prism 的所有功能都是互相链接的,这意味着当您对某个部分数据进行修改时,文档内的所有相关数据都会进行更新,包括生成的图形和布局。通过此特性,您还可以更方便地即时分析重复试验,在使用不同数据进行对比测试的时候,您将不再需要重复操作之前的步骤。虽然主要用作于数据处理,但 GraphPad Prism 依旧可以伴随您对整个实验进行记录,您可以在每个文件中添加无限量的数据表、信息页、分析结果、图形和页面布局等信息。在数据表中,除了您已确定并进行绘制的数据,您还可以保留被排除的数据,它们不会影响您的分析结果,但可以让您随时回顾整个实验信息。而在信息页中,您可以存储任何非结构化笔记和结构化信息常量,例如批号、浓度甚至笔记本页码等,让您不遗漏任何一个实验细节。同时您还可以用带颜色标记的浮动笔记注释任何页面信息,便于您或别人在实验结束后更方便的理解相关信息。
Prism Analyze, graph and present your scientific work.
The preferred analysis and graphing solution purpose-built for scientific research. Join the world’s leading scientists and discover how you can use Prism to save time, make more appropriate analysis choices, and elegantly graph and present your scientific research.
Comprehensive Analysis and Powerful Statistics, Simplified
Organize Your Data Effectively
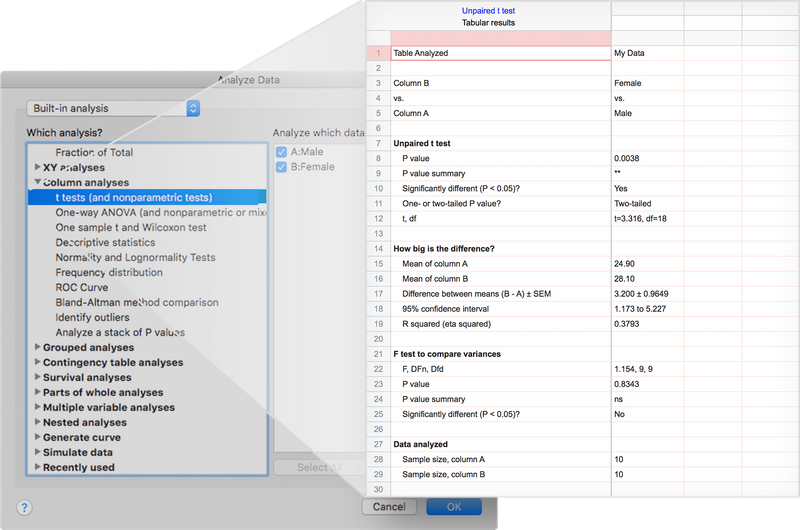
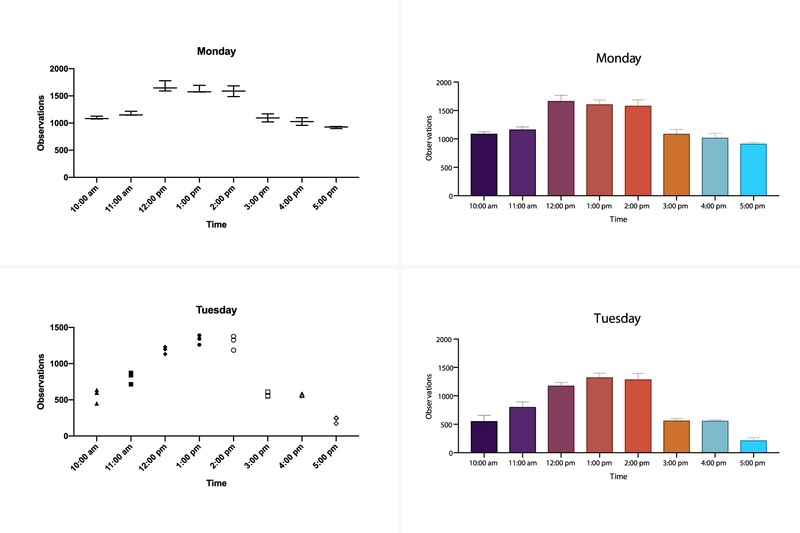
Unlike spreadsheets or other scientific graphing programs, Prism has eight different types of data tables specifically formatted for the analyses you want to run. This makes it easier to enter data correctly, choose suitable analyses, and create stunning graphs.
Perform The Right Analysis
Avoid statistical jargon. In clear language, Prism presents an extensive library of analyses from common to highly specific—nonlinear regression, t tests, nonparametric comparisons, one-, two- and three-way ANOVA, analysis of contingency tables, survival analysis, and much more. Each analysis has a checklist to help you understand the required statistical assumptions and confirm you have selected an appropriate test.
Get Actionable Help As You Go
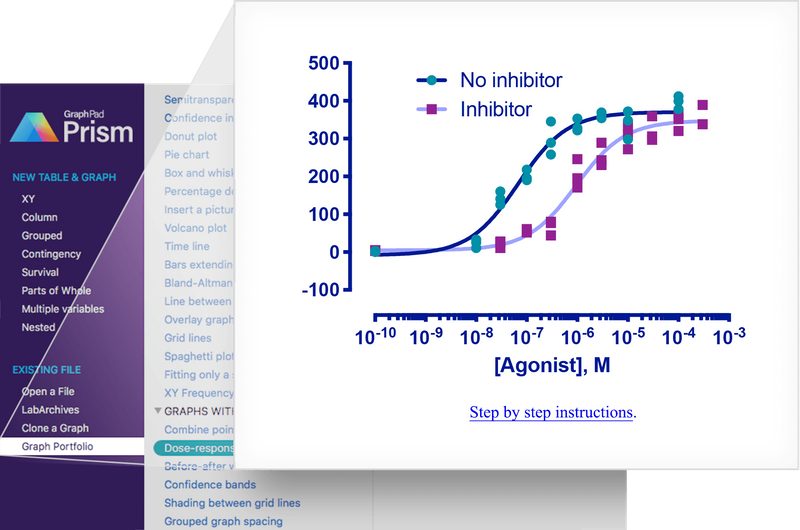
Reduce the complexity of statistics. Prism’s online help goes beyond your expectations. At almost every step, access thousands of pages from the online Prism Guides. Browse the Graph Portfolio and learn how to make a wide range of graph types. Tutorial data sets also help you understand why you should perform certain analyses and how to interpret your results.
Work Smarter, Not Harder
One-Click Regression Analysis
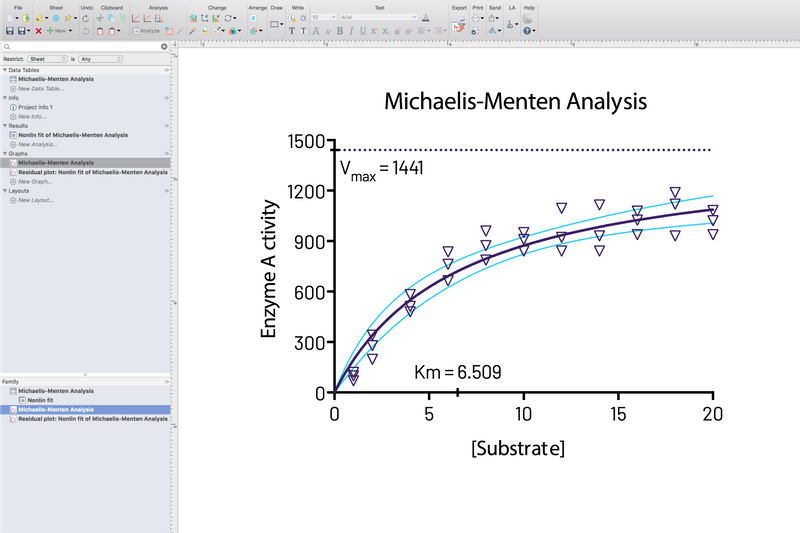
No other program simplifies curve fitting like Prism. Select an equation and Prism does the rest—fits the curve, displays a table of results and function parameters, draws the curve on the graph, and interpolates unknown values.
Focus on Your Research, Not Your Software
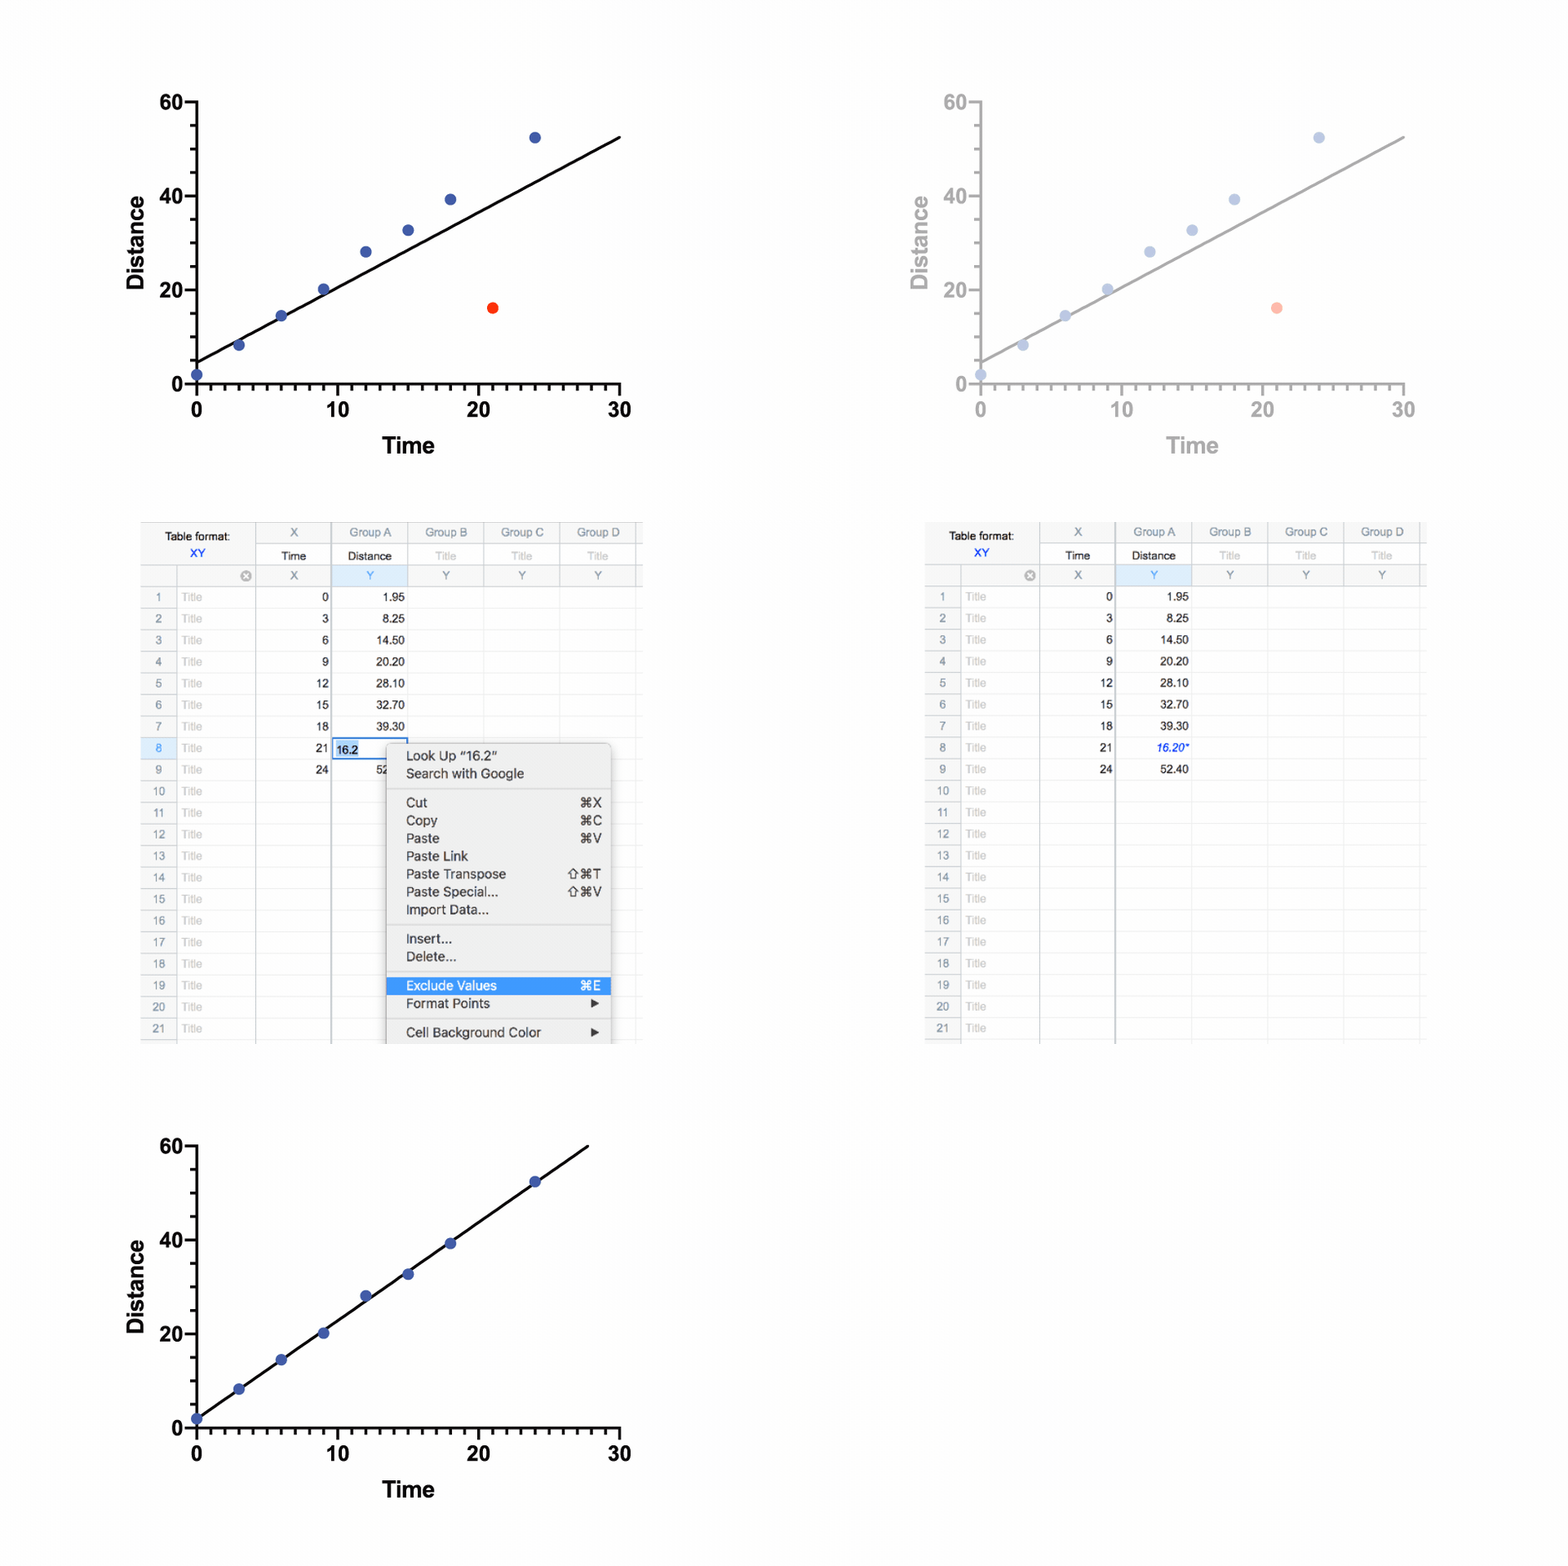
No coding required. Graphs and results are automatically updated in real time. Any changes to the data and analyses—adding missed data, omitting erroneous data, correcting typos, or changing analysis choices—are reflected in results, graphs, and layouts instantaneously.
Automate Your Work Without Programming
Reduce tedious steps to analyze and graph a set of experiments. It is easy to replicate your work by creating a template, duplicating a family, or cloning a graph—saving you hours of set up time. Apply a consistent look to a set of graphs with one click using Prism Magic.
The Fastest Way to Elegantly Graph and Share Your Work
Countless Ways to Customize Your Graphs
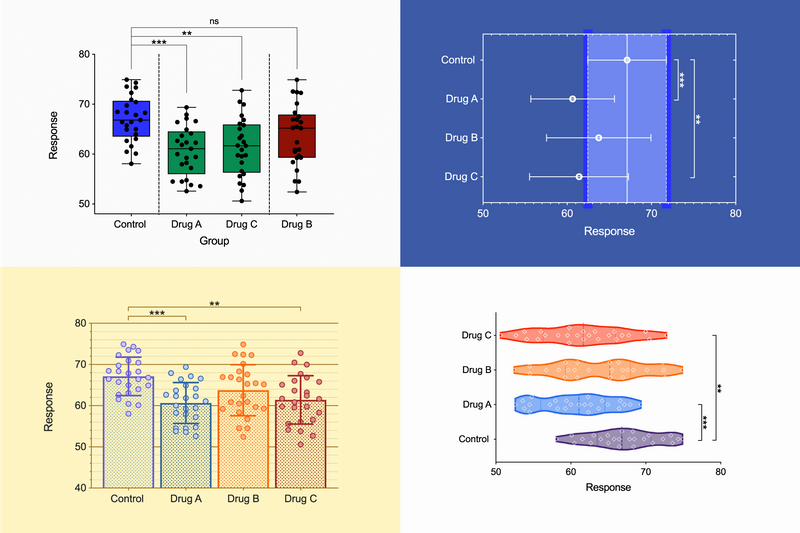
Focus on the story in your data, not manipulating your software. Prism makes it easy to create the graphs you want. Choose the type of graph, and customize any part—how the data is arranged, the style of your data points, labels, fonts, colors, and much more. The customization options are endless.
Export Publication-Quality Graphs With One Click
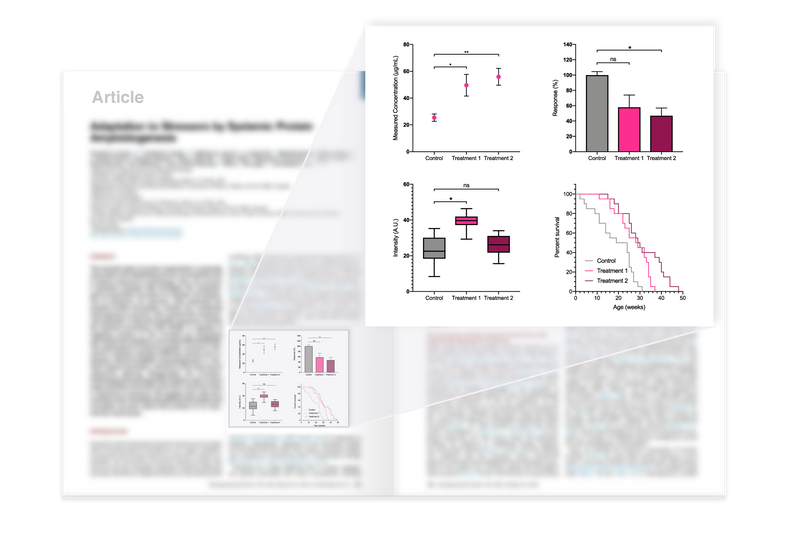
Reduce time to publish. Prism allows you to customize your exports (file type, resolution, transparency, dimensions, color space RGB/CMYK) to meet the requirements of journals. Set your defaults to save time.
Enhance Collaboration
Share more than your graphs. Prism’s comprehensive record of your data enables effective collaboration with other scientists. All parts of your Prism project (raw data, analyses, results, graphs, and layouts) are contained in a single file that you can share with one click. Now others can easily follow your work at every step, enhancing the clarity of your findings and streamlining your collaborative efforts.

Home Page: https://www.graphpad.com
下载地址
科学制图 GraphPad Prism v9.4.0.673 x64 for Windows
123云盘:https://www.123pan.com/s/PjcA-aDCRA
百度网盘:https://pan.baidu.com/s/1KUfeyccsRsbqpFG1JfJVPA?pwd=1j39 提取码:1j39
科学制图 GraphPad Prism 8.0.2.263 Windows x86 x64 简体中文汉化
落尘之木原创汉化,2019.12.16
落尘之木:https://dl.luochenzhimu.com/software/Prism/GraphPad_Prism_8.0.2.263_x86_x64_Win_zh_CN.zip
百度网盘:https://pan.baidu.com/s/1ck4sYsIE6LeogJq8Ihkuyg
科学制图 GraphPad Prism 9官方最新版下载:
Windows 64 Bit: https://cdn.graphpad.com/downloads/prism/9/InstallPrism9.msi
macOS: https://cdn.graphpad.com/downloads/prism/9/InstallPrism9.dmg
 落尘之木
落尘之木



9的能汉化一下么
不是有官方中文了吗
找不到下载资源
需要的话我看能不能导入之前8版本的汉化数据到9,但是没有人测试反馈汉化质量
我百度看到了好像是官方中文的版本,但是不付费好像不能下载,也没搜到安装包,还有就是不知道pj通不通用,如果您能移植一下8的汉化,我可以测试一下看怎么样
很多术语很难翻译准确
暂时搞不定哦,软件有检验修改文件后打不开